
Tim Baker, CFA
Founder & CEO
The Factor Report
Week Ended July 24, 2026
Market Wrap
For the week ended July 24th, 2026, stocks were mixed but lower globally. Bonds were lower for the week as the iShares Core US Aggregate Bond ETF (AGG) fell 0.75% with yields rising; the 10-year US treasury yield increased to 4.68%, according to Yahoo Finance. Asset price drivers of the week:
- As would turn out to be the theme much of the week, investors had little data to react to on Monday, but sent stocks mostly lower as fighting between the US and Iran resumed.
- Tuesday was the one bright spot in the week as investors did some bargain hunting in Tech and Tech-related stocks, which pulled indices higher.
- On Wednesday, continued fighting in the Middle East kept investors on edge as they awaited earnings reports from Google and Tesla.
- Stocks slumped on Thursday on mixed reports. Both Google and Tesla beat revenue estimates, but reported significantly higher spending on AI efforts and said that would continue for some time. This raised concerns about near-term earnings and the long-term profitability of those efforts.
- Investors got some good news on Friday as new home sales and building permits came in better than estimates, but an early rally fizzled late in the day as there does not appear to be an end in sight in Iran.
- Next week will be a busy and important one as we will get durable goods orders, consumer confidence and the Federal Reserve's preferred measure of inflation, the Personal Consumption Expenditures price index. Unfortunately, that will come a day to late as the Fed will announce their interest rate decision and economic outlook on Wednesday.
Performance Summary
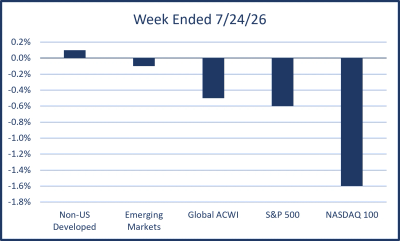
As shown in the chart, Non-US Developed again held up the best for the week and turned in a small gain. Emerging Markets were moderately lower and the US lagged behind. Within the US, the tech-heavy Nasdaq was by far the biggest drag on the broader market as the more traditional stocks of the Dow Jones Industrial Average outperformed. From a factor perspective, all factors in the US beat the broader S&P 500.
In The News
What really makes a good retirement plan?
The IRS is automating first-time penalty relief.
Why oil dropped on Friday.
https://www.cnbc.com/2026/07/24/oil-price-trump-hormuz-red-sea-iran-war.html
Disclosures
Past performance may not be indicative of future results. Different types of investments involve varying degrees of risk. Therefore, it should not be assumed that future performance of any specific investment or investment strategy will be profitable or equal the corresponding indicated performance level(s). Moreover, you should not assume that any of the above content serves as the receipt of, or as a substitute for, personalized investment advice from Metric Financial.
All data and performance information sourced from Morningstar and MarketWatch, unless otherwise indicated.
USA is the MSCI USA index, Non-US Developed is the MSCI EAFE index, Emerging Markets is the MSCI Emerging Markets index, and All Country World is the MSCI ACWI index. One cannot invest in an index. Because the factor indexes have varying inception dates, some of the returns provided are back-tested and do not represent actual performance. Inception dates are as follows:
Momentum = MSCI ACWI Momentum NR USD Index (Inception: 11/30/95)
Value = MSCI ACWI Enhanced Value NR USD Index (Inception: 5/29/15)
Quality = MSCI ACWI Quality NR USD Index (Inception: 5/29/92)
Low Volatility = MSCI ACWI Minimum Volatility (USD) NR USD Index (Inception: 5/28/93)
Size = MSCI ACWI Risk Weighted NR USD Index (Inception: 4/6/11)
Metric Financial, LLC (“Metric”) is a registered investment adviser offering advisory services in the State of Connecticut and in other jurisdictions where exempted. Registration does not imply a certain level of skill or training. Follow-up or individualized responses to consumers in a particular state by Metric in the rendering of personalized investment advice for compensation shall not be made without our first complying with jurisdiction requirements or pursuant to an applicable state exemption.
All written content is for information purposes only. Opinions expressed herein are solely those of Metric, unless otherwise specifically cited. Material presented is believed to be from reliable sources and no representations are made by our firm as to another parties’ informational accuracy or completeness. All information or ideas provided should be discussed in detail with an advisor, accountant or legal counsel prior to implementation.
Returns for ETFs representing the designated geographies. Source: investing.com